


T4 target
The simulation using Geant3 and taking data from the SPY collaboration [1] and Atherton [2] shows the particle production in the T4 target. As the configuration of T2 is similar, the displayed results are as well valid for H2 and H4.
Particle Production at T4
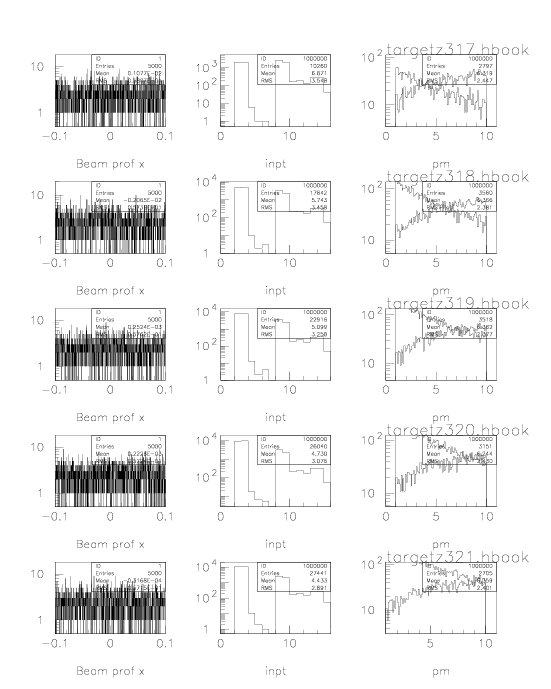
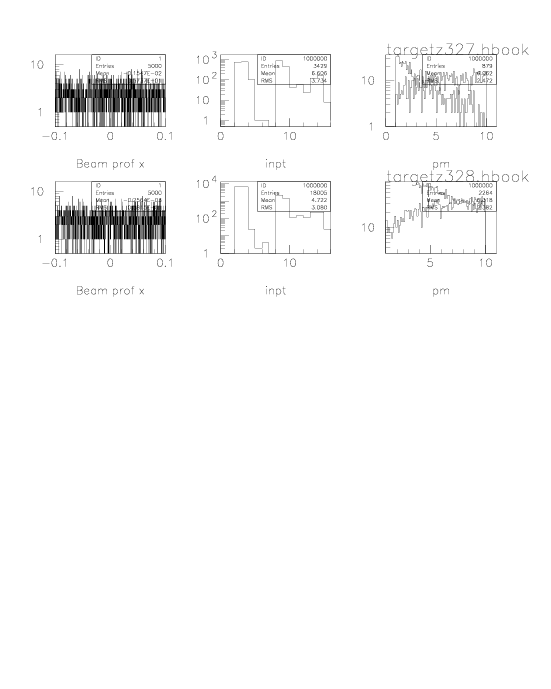
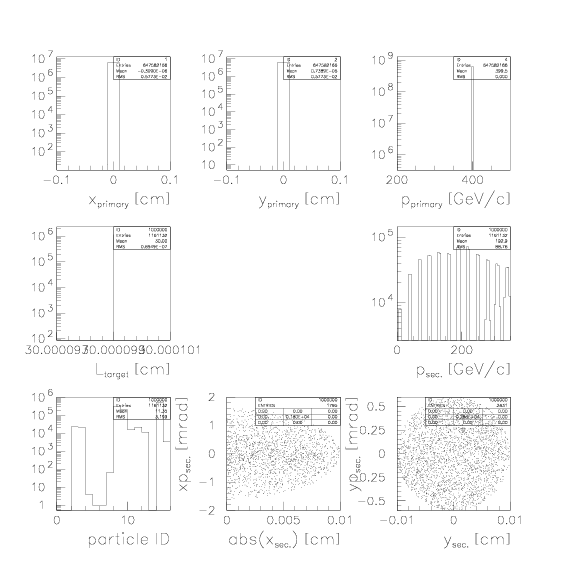
Using the simulation tool Geant3 (source, lsf batch files), the particle production at T4 was simulated assuming a primary proton beam of 400 GeV/c (half size 0.1mm in x and y). The target consists of a Beryllium plate with a length of 30 cm (hy=2mm, bx=160mm). Production rates are simulated within the limits of ±0.1mm and ±12(2)mrad. Energy cuts are made as shown in Figure pm below in order to keep final ntuples small. An overall in/output beam is shown in the next two figures. The total number of simulated protons on target (pot) is 108. All plots are accumulated in a ps-file.
hadron production for various target configurations
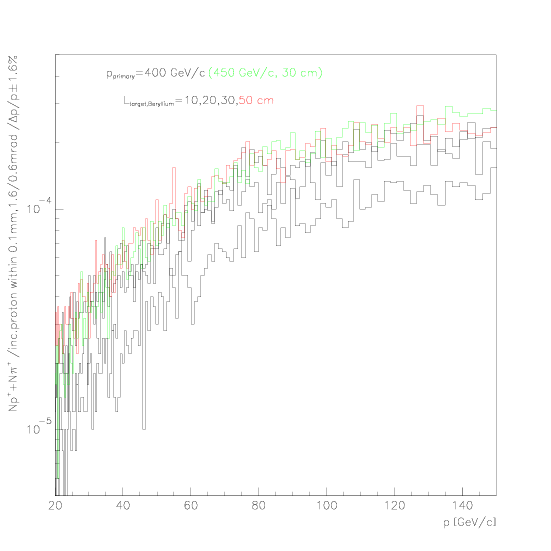
The production for several Beryllium target lengths is shown. The production increases with the length. The maximum target length available in T4 without modification is 30 cm. The difference in the primary momentum of 400 or 450 GeV/c is negligible. The production at 80 Ge/v is about 3 times higher than at 40 GeV/c. The production of positives is 20% lower than for positives, which is due to the fact, that for positives this additional pridcution yield of positive hadrons is made up of secondary protons.
emmittance at T4
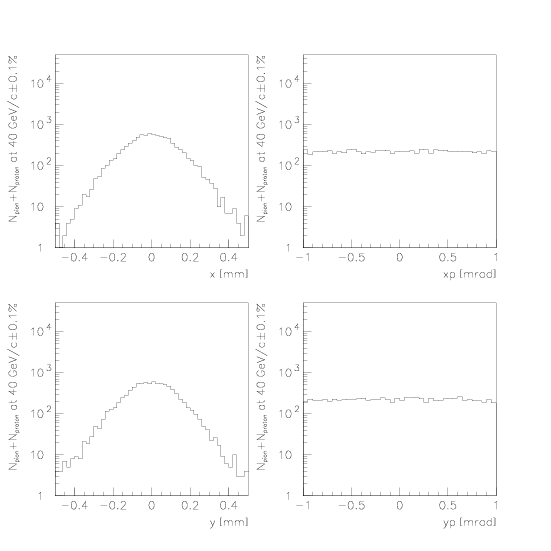
The acceptance of the transfer line from T4 to H8 is 0.1 mm in both planes and 1.6/0.6 mrad in horizontal/vertical plane. Within this range the production is indedpendent of position and angle.
Background
We still need to display here the background. What is of interest? Electrons?
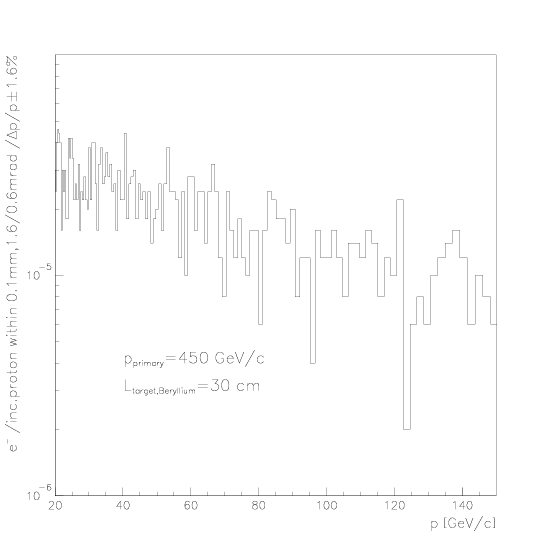
The prodcution of electrons and positrons is equivalent.
![]()
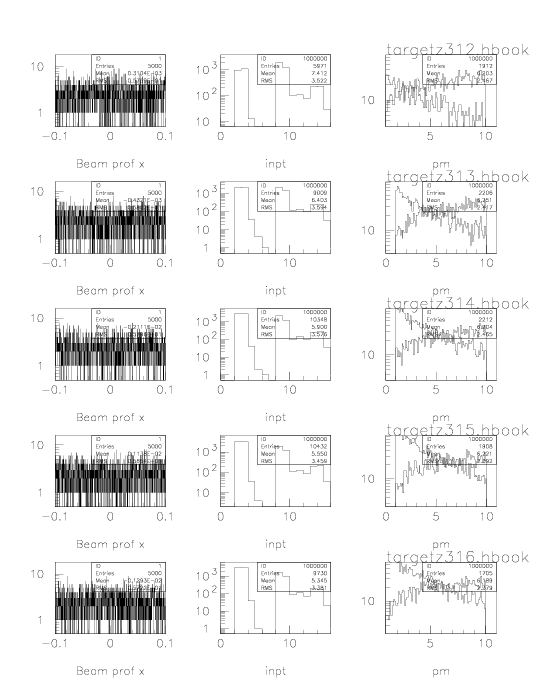
This is to verify the correlation to the source data and the correct input: control1 control2 control3
Particle Production at the Primary Target T4
implement: why we need it, what it serves for (quick look-up for eestimates), conclusion (particle ratios), agreement with exp data from SPY and Athetton.
Using the simulation tool Geant3 (source, lsf batch files), the particle production at T4 was simulated assuming a primary proton beam of 400 GeV/c (half size 0.1mm in x and y). The target consists of a Beryllium plate with a length of 30 cm (hy=2mm, bx=16mm). Production rates are simulated within the limits of ±0.1mm and ±12(2)mrad. Energy cuts are made as shown in Figure pm below in order to keep final ntuples small. An overall in/output beam is shown in the next two figures. The total number of simulated protons on target (pot) is 108. All plots are accumulated in a ps-file.
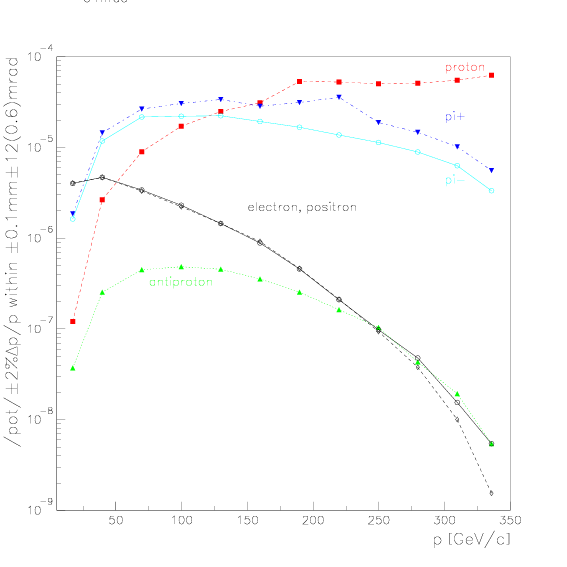
Production Yield
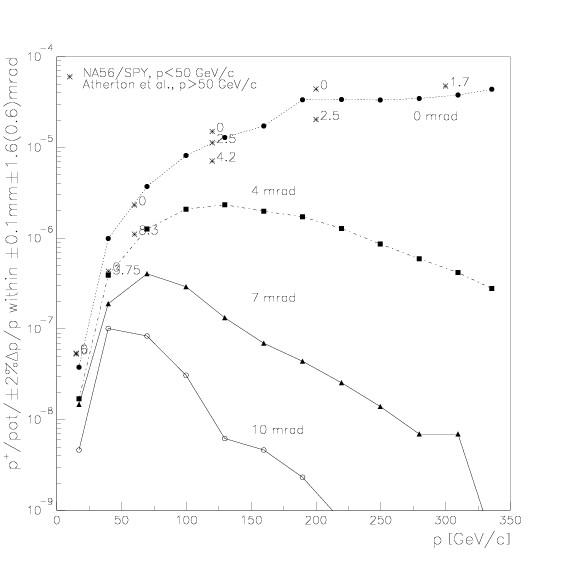
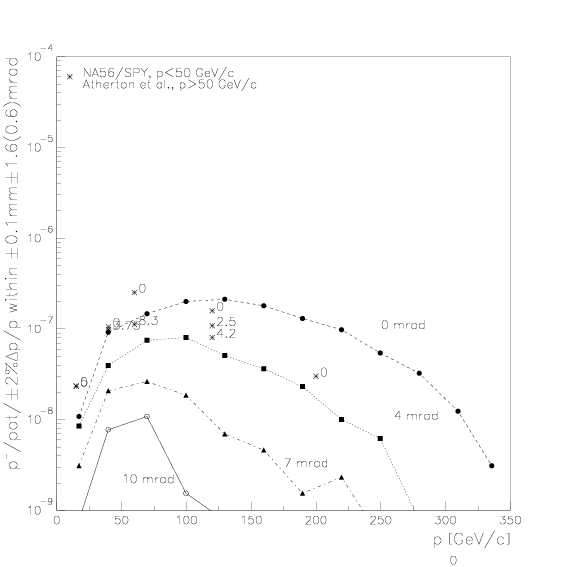
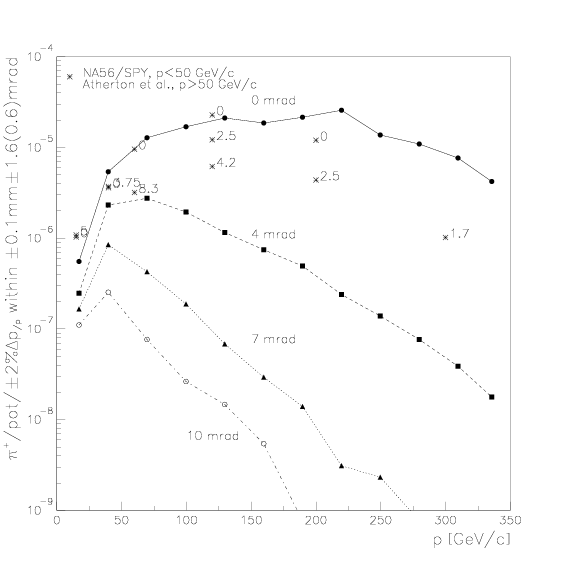
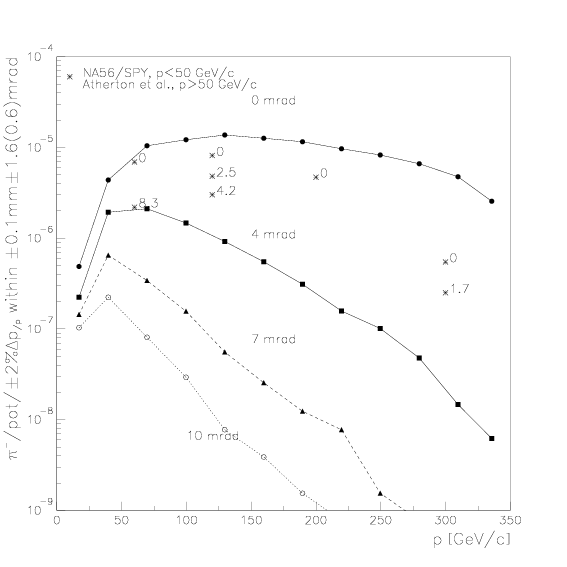
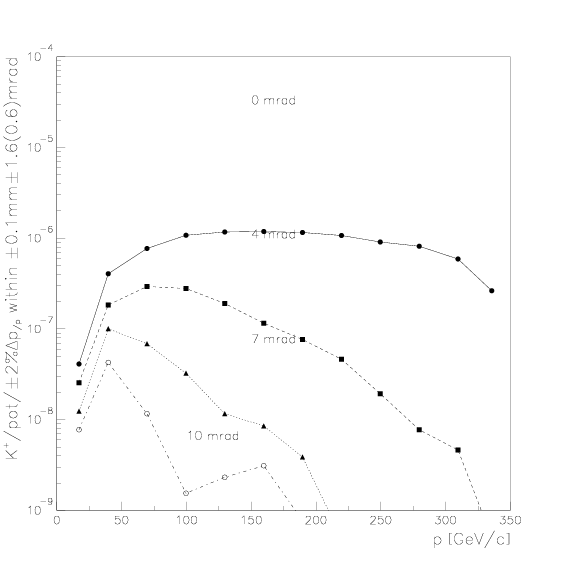
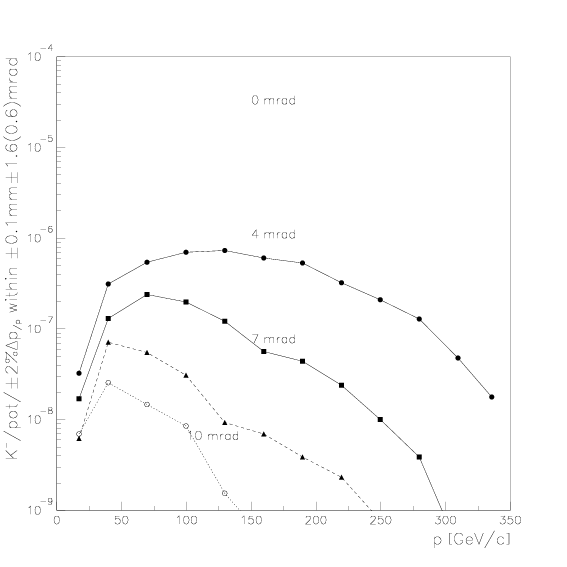
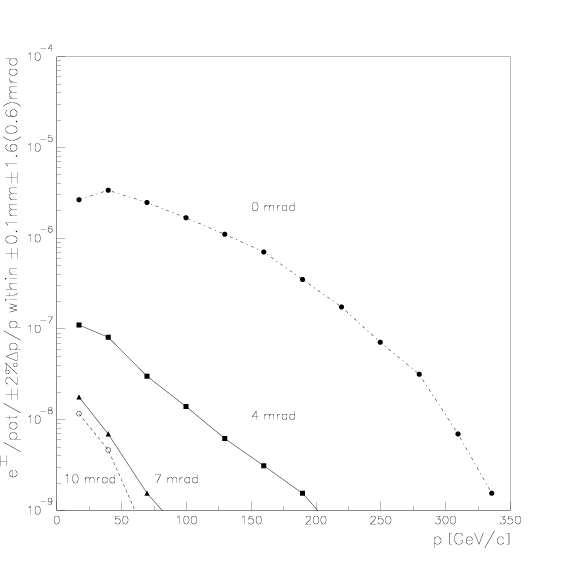
Production yields have been simulated for (anti-)protons, pions and electrons. Production rates are normalized per proton on target (pot). Momentum acceptance is taken to be ±2% Λp/p and phase acceptance is ±0.1mm for both planes and ±1.6 (0.6) mrad for the divergence x' (y') centered at the chosen production angle. Production angles are typically chosen as 0, 4, 7 and 10 mrad.
The first figure shows the yield for protons as a function of central energy for four different production angles. The production of antiprotons is by far smaller, especially at 0 mrad production, where primary scattered protons dominate for high energies. Plot ranges of all four plots are the same for easier comparison.
The production yield of pions is shown next. The rate for negative pions is by 10-15% lower than for positives. Electrons from the induced electromagnetic cascade are shown in the last plot. Indication of production yield below 10-9 is not shown, as the statistics of primary protons simulated do not allow this. Kaons are not taken into account (can still be done easily by changing the kumac, but won't change the picture, as production is always one order at least of magnitude lower than of pions).
[1] The NA56/SPY collaboration: Ambrosini et al., Eur. Phys. J. C 10, 605-627 (1999)